 SmartBMS Utility
← Back to all featuresFeature
Logging
Step into data-driven energy management: track history, spot anomalies, and make decisions backed by real numbers.
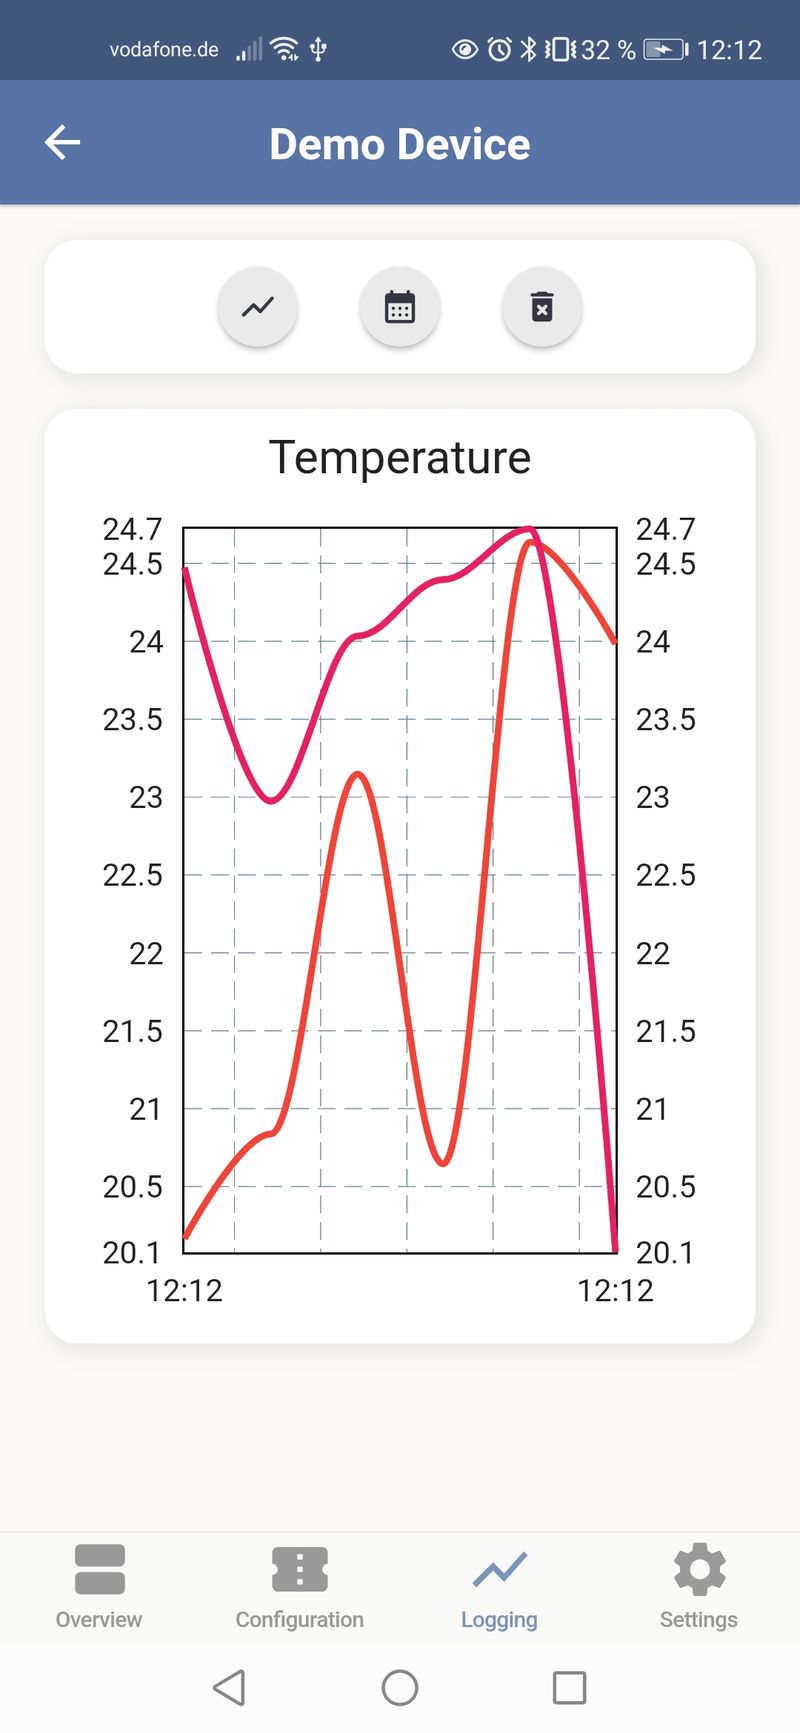
Full history, not just a snapshot
Visualize voltage trends, temperature variation, and charge/discharge cycles over time — the same data your BMS is already collecting, finally readable.
Anomaly detection
Get flagged when a reading drifts outside its normal range, so a developing problem doesn't stay invisible until it's a failure.
Shareable reports
Export what you're seeing to share with a dealer, an installer, or our support team — the same debug log export used for technical troubleshooting.
Trend, not just status
See whether a cell is drifting before it becomes a warning.
Evidence for support
Send real logs instead of describing a problem from memory.
Better long-term decisions
Plan capacity and maintenance around actual usage patterns.
Chart types available
- ▸Total voltage
- ▸Current
- ▸Power
- ▸Remaining capacity
- ▸State of charge
- ▸Temperature
- ▸Cell voltage